
Real-time high-performance traffic capture, analytics, and insights for traditional architecture and cloud
CORE CAPABILITIES
Key capabilities
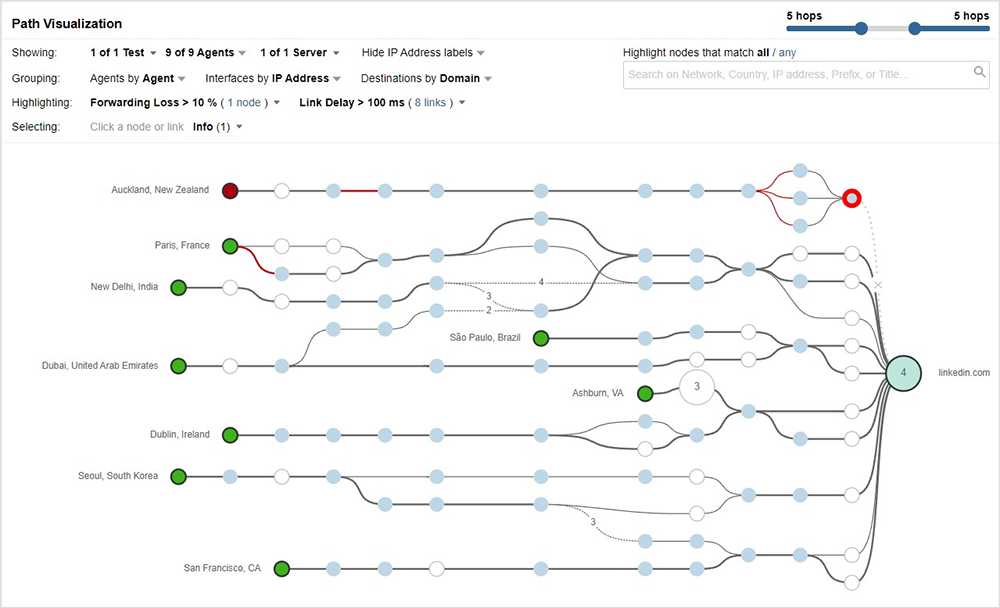
Provides full visibility into network performance, from branch and edge traffic to core data centers and backbone links.
Correlates flow records and packet data in a single platform to reveal traffic patterns, bandwidth utilization and application behavior.
Supports granular views by site, device, link, application and user to quickly understand who is using what, where and how.
Real-time performance monitoring & reporting
High-efficiency traffic retention
Compressed raw-traffic storage with at least 50% compression to extend retention windows while controlling cost.
Rich, interactive visualization
Second-level refresh dashboards, multi-dimensional views, unlimited drill-down and dynamic baselines to accelerate anomaly detection.
Quantified network quality
Bi-directional metrics such as latency, retransmissions, out-of-order and packet loss, with IPv4/IPv6 comparison and SRv6 decoding for modern networks.
Flexible reporting for IT & business
Real-time and scheduled reports, plus customizable dashboards for hypercare follow-up, SLA tracking and management reviews.
Intelligent alerts and fault diagnosis
Smart alerts & localization
Baseline-deviation and composite alerts with real-time threshold simulation, reducing noise while surfacing critical issues; one-click RCA via automatic correlation.
End-to-end dependency mapping
Auto-discovers well-known and private applications, maps service dependencies, and distinguishes network vs. application bottlenecks.
Session-level forensics
Searches sessions globally by time, IP and other clues; exports raw packets and metrics for deep analysis, audit and evidence.
Application issue analysis
Identifies apps via 5-tuple, HTTP paths, signatures (regex), VoIP sessions, DNS queries and more; quantifies application experience and reconstructs TCP sessions for detailed troubleshooting.
Mini architecture
Collect → Data Platform → AI → Apps/Workflows → Integrations
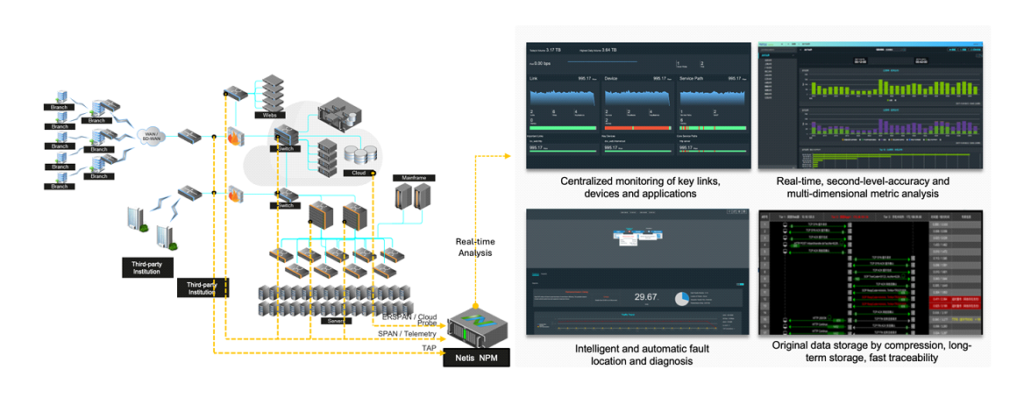
Collection (SPAN/Xflow)
Data (≥50% compression / Metrics and Packets are stored separately)
AI/Action (Automatic baseline / one‑click RCA)
CORE CAPABILITIES

Deployment & specs
⦁ Form factors: (2U Probes; 2U Management Platform; VM Probe/Platform)
⦁ Throughput per probe: (10–100 Gbps for 2U)
⦁ Storage/ports options: (NL-SAS; 10/40/100G NIC)
⦁ Supported stacks/protocols: (e.g., IPv4/IPv6/SRv6; TLS/HTTP/DB)??
Top 5 integrations
| Category | System | Method | Typical Action |
|---|---|---|---|
| ITSM | ServiceNow | REST / Webhook | Auto ticket |
| SIEM | Splunk | Kafka / Syslog | KPI, Alert |
| Cloud / Network | AWS / Alibaba / Huawei | Probe / Mirroring | Hybrid visibility |
| Monitoring | Zabbix | Pull | SNMP |